Introduction Of Geographical Information System (GIS)
Geography is the study of Earth’s features and patterns of their variations in spatial location and time. Geographical Information Systems or GIS enable representation and integration of such spatial information.Many questions of agricultural production are geographic in nature as the production depends on the environment and prevailing socio-economic conditions, both of which vary spatially and in time. Examples are questions related to natural resources management, precision agriculture, agroecological classification for land use planning, regional trends and patterns in technology adaptation, agricultural productivity and income, non-pont source pollution from agricultural lands, etc. Answering these questions requires access to large volumes of multidimensional geographical (spatial) information of weather, soils, topography, water resources, socio economic status, etc.
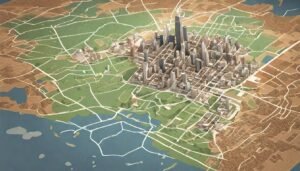
Further, answers to even apparently simple questions require that the data from several sources be integrated in a consistent form. The traditional method of presenting geographical information in two dimensions is in the form of maps. Maps are graphic representations of the earth’s surface on a plane paper They shape the way we visualize, assess and analyze spatial information. A map consists of points, lines and area elements that are positioned with reference to a common coordinate system (usually latitude and longitude).
Use of Geospatial Data
They are drawn to specified scales and projection.Map scales can vary and depend on the purpose for which the maps are created. Projection is a mathematical transformation used to represent the real 3-dimensional spherical surface of the earth in 2-dimensions on a plane sheet of paper. The map legend links the non-spatial attributes (name, symbols, colours, thematic data) to the spatial data. The map itself serves to store and present data to the user. Such, analogue maps (on paper) are cumbersome to produce and use, particularly when there are a large number of them to be used for analysis.
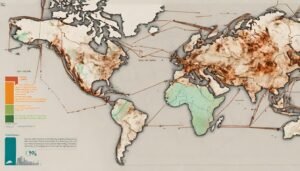
Computer based GIS facilitates both creation of maps and using them for various complex analyses. It allows working with geographic data in a digital format to aid decision making in resources management GIS is a generic term implying the use of computers to create and display digital maps. The attribute data which describe the various features presented in maps may relate to physical, chemical, biological, environmental, social, economic or other earth surface properties. GIS allows mapping, modelling, querying, analyzing and displaying large quantities of such diverse data, all held together within a single database. Its power and appeal stem from its ability to integrate quantities of information about the environment and the wide repertoire of tools it provides to explore the diverse data. The history of development of GIS parallels the history of developments in digital computers and database management systems on one hand and those in cartography and automation of map production on the other. The development of GIS has also relied upon innovations made in several other disciplines – geography, photogrammetry, remote sensing, civil engineering, statistics, etc.
Mapping Using Geographic Information Systems (GIS)
GIS produces maps and reads maps. Its major advantage is that it permits identifying spatial relationships between specific different map features. It can create maps in different scales, projections and colours. But it is not just a map making tool. It is primarily an analytical tool that provides new ways of looking at, linking and analyzing data by projecting tabular data into maps and integrating data from different, diverse sources. This it does by allowing creation of a set of maps, each with a different theme (soils, rainfall, temperature, relief, water sources, etc.).
From its early beginnings, GIS has been an integrating technology both from the point of view of its development as well as its use. This is because, once geographic information of any kind is translated into the digital form in a GIS, it becomes easy to copy, edit, analyze, manipulate and transmit it. This allows vital linkages to be made between apparently unrelated activities based on a common geographic location. This has led to fundamental changes in the way resource management decisions are made in a variety of situations forest management, marketing management, utility management, transportation, as well as in agricultural, environmental and regional planning and management. Some potential agricultural applications where GIS can lead to better management decisions are: precision farming, land use planning, watershed management, pest and disease management, irrigation management, resources inventory and mapping, crop area assessment and yield forecasting, biodiversity assessment, genetic resources management, etc.
Defination OF Geographic Information Systems (GIS)
A Geographic Information System (GIS) is basically a computerized information system like any other database, but with an important difference: all information in GIS must be linked to a geographic (spatial) reference (latitude/longitude, or other spatial coordinates).
|
GIS= G+IS Geographic reference + Information system Data of spatial coordinates Database of attribute data on the surface of the earth corresponding to spatial (Map) – location data location and procedures to provide information for decision making
GIS = IS with geographically referenced data
|
There are many different definitions of GIS, as different users stress different aspects of its use.
For example:
(i) ESRI defined GIS as an organized collection of computer hardware, software, geographic data and personnel designed to efficiently capture, store, update, manipulate, analyze and display geographically referenced information.
(ii) ESRI also provided a simpler definition of GIS as a computer system capable of holding and using data describing places on the earth’s surface).
(iii) Duecker defined GIS as a special case of information systems where the database consists of observations on spatially distributed features, activities or events, which are definable in space as points, lines or areas. A GIS manipulates data about these points, lines or areas to retrieve data for ad hoc queries and analyses.
The United States Geological Survey (USGS) defined provided A GIS as a computer hardware and software system designed to collect, manage, analyze and display geographically (spatially) referenced data. This definition is a fairly comprehensive and is suitable for agricultural applications of GIS .
Note that a GIS does not store a map or image. What it stores is a relational database fromwhich maps can be created as and when needed. Relational database concepts are particularly crucial to the development of GIS. Each map (say a soil map) can be considered to hold a layer or a level of information. A GIS works with several layers of such thematic data. It can answer questions by comparing the different layers and also by overlaying them if all the layers are referenced to the same locations, that is location is the common key for all the thematic data sets. This ensures that every location (spatial reference point) is exactly matched to its location on other maps. Once this is done, the different layers can be compared and analyzed singly and in combination to identify spatial patterns and processes. Thus, GIS are related to other database applications, but with an important difference; all information in a GIS must be linked to a spatial reference. Other data bases may contain locational information (addresses, pin,codes etc), but the GIS uses georeferences as the primary means of storing and accessing information.
WHAT A Geographic Information Systems (GIS) CAN DO
There are five basic questions which a complete GIS must answer. These are: What exists at a particular location? Given a geographic reference (eg Lat, long) for a location, the GIS must describe the features of that location. Where can specific features be found? This is the converse of the first question. For example, where are the districts with rainfall greater than 500 mm and less than less than 750 mm?

Trends or What has changed over time? This involves answering both questions above. For example, at what locations are the crop yields showing declining trends?
What spatial patterns exist? if occurrence of a pest is associated with a hypothesized set of conditions of temperature, precipitation, humidity, where do those conditions exist?
Modelling or What if …?
This is a higher-level application of GIS and answers questions like what would be the nitrate distribution in groundwater over the area if fertilizer use is doubled?
The abilities to separate great quantities of information about the environment into layers, explore each layer with a powerful suite of analytical tools, and then combine the layered information to use it in an integrated fashion is what makes the GIS a powerful and effective decision-support tool for agricultural and environmental management.



its very Informative carry on your struggles
Good
nice